Reading performance data with JavaScript.
30 Jun 2020 · 7 min readHow fast is my website on the user device? Did my code change have any negative effect on the page loading time?
These are questions which we can answer with the Navigation Timing API!
With this API it is possible to read various performance data via JavaScript. We can use it to get real device performance measurements from our website visitors or for quickly checking code and website changes at developing time.
We can already see the page load time in Google Analytics (Behavior > Site Speed), but to find out where we can optimize we usually need some more data.
Navigation Timing v1
The first version of Navigation Timing is a well supported solution to read out performance data. You can access it data via the performance.timing object.
console.table(performance.timing);Output:
| index | Value |
|---|---|
| navigationStart | 1593164606981 |
| unloadEventStart | 0 |
| unloadEventEnd | 0 |
| redirectStart | 0 |
| redirectEnd | 0 |
| fetchStart | 1593164606987 |
| domainLookupStart | 1593164606990 |
| domainLookupEnd | 1593164607010 |
| connectStart | 1593164607010 |
| connectEnd | 1593164607249 |
| secureConnectionStart | 1593164607199 |
| requestStart | 1593164607250 |
| responseStart | 1593164607266 |
| responseEnd | 1593164607284 |
| domLoading | 1593164607296 |
| domInteractive | 1593164608387 |
| domContentLoadedEventStart | 1593164608587 |
| domContentLoadedEventEnd | 1593164608590 |
| domComplete | 1593164609302 |
| loadEventStart | 1593164609302 |
| loadEventEnd | 1593164609302 |
All values are in the JavaScript timestamp format. (milliseconds since January 1, 1970)
Unfortunately, this leads to the situation that we first have to do a few calculations in order to come to meaningful output.
To get something like "domComplete after 1 second" we have to subtract the navigationStart timestamp from the domComplete timestamp. Chronologically the navigationStart is the first event that gets logged.
So we can run domComplete - navigationStart and we will get 2321 as result. (1593164609302 - 1593164606981)
In other words the moment when document.readyState jumped to complete was after 2.3 seconds.
The browser support of Navigation Timing is very good, every browser except Internet Explorer 11 supports it, but v1 is outdated and will soon be replaced by Navigation Timing v2.
Navigation Timing v2
In the new version we access the data via
performance.getEntriesByType("navigation")The values are no longer timestamps but already the milliseconds since the navigationStart event.
console.table(
	performance.getEntriesByType("navigation")[0]
);
Output:
| index | Value |
|---|---|
| unloadEventStart | 0 |
| unloadEventEnd | 0 |
| domInteractive | 1405.5849999999737 |
| domContentLoadedEventStart | 1606.17000000002 |
| domContentLoadedEventEnd | 1609.4399999997222 |
| domComplete | 2320.669999999609 |
| loadEventStart | 2320.7649999999376 |
| loadEventEnd | 2320.7800000000134 |
| type | "navigate" |
| redirectCount | 0 |
| initiatorType | "navigation" |
| nextHopProtocol | "http/1.1" |
| workerStart | 0 |
| redirectStart | 0 |
| redirectEnd | 0 |
| fetchStart | 5.5749999996805855 |
| domainLookupStart | 8.484999999836873 |
| domainLookupEnd | 29.160000000047148 |
| connectStart | 29.160000000047148 |
| connectEnd | 268.12500000005457 |
| secureConnectionStart | 217.72499999997308 |
| requestStart | 268.50500000000466 |
| responseStart | 284.6549999999297 |
| responseEnd | 302.77499999965585 |
| transferSize | 29889 |
| encodedBodySize | 29347 |
| decodedBodySize | 134069 |
| serverTimingname | "https://example.com/" |
| entryType | "navigation" |
| startTime | 0 |
| duration | 2320.7800000000134 |
So our example code for domComplete would change to
performance.getEntriesByType("navigation")[0].domCompleteThe data we are getting back now is 2320.66999999999609, a value which is much more accurate than in v1 (at Firefox it is still rounded to 2321).
Also noticeable is that the domLoading event is no longer available, but some new informations like "redirectCount" and "nextHopProtocol" is.
Browser support is not as good here - for example in Safari we still have to work with the Navigation Timing v1.
Significant events
| Event | Description |
|---|---|
| navigationStart | User has entered or accessed a URL |
| fetchStart | Browser is ready to load the document |
| domainLookupStart | IP is fetched from the DNS server |
| domainLookupEnd | IP was fetched from DNS serve |
| connectStart | Browser establishes the connection |
| connectEnd | Connection is established |
| requestStart | Browser sends the HTTP request |
| responseStart | Server responds |
| responseEnd | Server response is complete |
| domLoading | Browser starts document parsing (deprecated - v1 only) |
| domComplete | Document parsed |
| loadEventStart | document.onload JavaScript is executed |
| loadEventEnd | document.onload JavaScript has been executed |
Read out interesting data
I usually use the following data to get a quick overview of the website speed
- Server response (Time To First Byte)
- Time needed to download the HTML file
- Time until DOM interactive
- Time until DOM complete
- Load event start and duration
Server response time (Time To First Byte)
How long did it take the server to start sending the HTML document? With responseStart - navigationStart we can check this.
A high value can indicate a long running server process or a slow internet connection.
Time needed to download the HTML file
This value tells us how long it has taken to download the complete HTML file. For this we use repsonseEnd - repsonseStart. If the value is high there are probably problems with the internet connection or the HTML document is unusually large.
Time until DOM interactive
JavaScript can block user input. For example, when we have complex and time-consuming JavaScript in the HEAD block, this time can become correspondingly long. So the number that we get is the time that the user may already have seen something on screen but was not able to do anything on the website.
Load event start and duration
One of the most important JavaScript events is the document load event. When it is executed depends on a number of different factors.
With loadEventStart we can see when the browser was ready to start the document.onload JavaScript, but even more interesting is that with the help of loadEventStop we can calculate how long it took to complete.
So loadEventEnd - loadEventStart is the full runtime of all the JavaScript code that is added with
document.addEventListener('load', ...Building a snippet.
We can now write a helper script which shows us all this data in the developer console.
(function() {
	let timing = performance.timing;
	let consoleOutput = '';

	let timings = {
		"Server response (TTFB)": timing.responseStart - timing.requestStart,
		"HTML download from Server": timing.responseEnd - timing.responseStart,
		"DOM interactive": timing.domInteractive - timing.navigationStart,
		"DOM complete": timing.domComplete - timing.navigationStart,
		"Load event start" : timing.loadEventStart - timing.navigationStart,
		"Load event end" : timing.loadEventEnd - timing.navigationStart,
		"Load event duration" : timing.loadEventEnd - timing.loadEventStart
	};

	for(let elementName in timings) {
		consoleOutput += (elementName + ' ').padEnd(32, '.') + ' ' + timings[elementName] + 'ms\n';
		// Note: You could also directly write it to the console or
		// print the timings array with console.table
	}

	console.log(consoleOutput);
})();
Output:
Server response (TTFB) ......... 2ms
HTML download from Server ...... 2ms
DOM interactive ................ 383ms
DOM complete ................... 1048ms
Load event start ............... 1048ms
Load event end ................. 1048ms
Load event duration ............ 0ms
This gives us a good first insight into the performance of a website.
If we want to access these values in a production environment we have to rewrite it a bit because otherwise it is possible that values like responseEnd and loadEventEnd would not be present when the code runs.
We can prevent this by inserting the code into the following function.
function measureTimings() {
	// Insert code for performance measurement here
}

if (document.readyState === "complete") {
	window.setTimeout(measureTimings, 0);
} else {
	document.addEventListener('readystatechange', () => {
		if (document.readyState === 'complete') {
			window.setTimeout(measureTimings, 0);
		}
	}, {passive: true});
}
This code ensures that we do not access the data until all values are available. Unfortunately neither the "onload" nor the "readystatechange" event has the value of loadEventEnd set, so we have to do the trick with setTimeout. This runs the code asynchronously at a later time.
The problems at development
These data are fine, but if we call the snippet on the system where we are currently programming, we will face the problem that the server response time can be very variable. For example, if the development server takes 3 seconds longer on the first call because the cache is still empty, the load event will also be delayed by 3 seconds.
To filter that out we can switch from using navigationStart to the responseEnd event. This gives use the time passed since the HTML file was completely downloaded and should be a much more constant value - regardless of how long server side PHP/JavaScript/.Net was running.
So our array changes to
	let timings = {
		"Server response (TTFB)": timing.responseStart - timing.requestStart,
		"HTML download from Server": timing.responseEnd - timing.responseStart,
		"DOM interactive": timing.domInteractive - timing.responseEnd,
		"DOM complete": timing.domComplete - timing.responseEnd,
		"Load event start" : timing.loadEventStart - timing.responseEnd,
		"Load event end" : timing.loadEventEnd - timing.responseEnd,
		"Load event duration" : timing.loadEventEnd - timing.loadEventStart
	};
The script was very handy when I worked at Restplatzbörse. At that company we had a slightly slower development system which took different amounts of time to deliver the HTML document depending on whether the PHP cache was already warmed up and on some other factors.
Adding the snippet to the Chrome Developer Tools
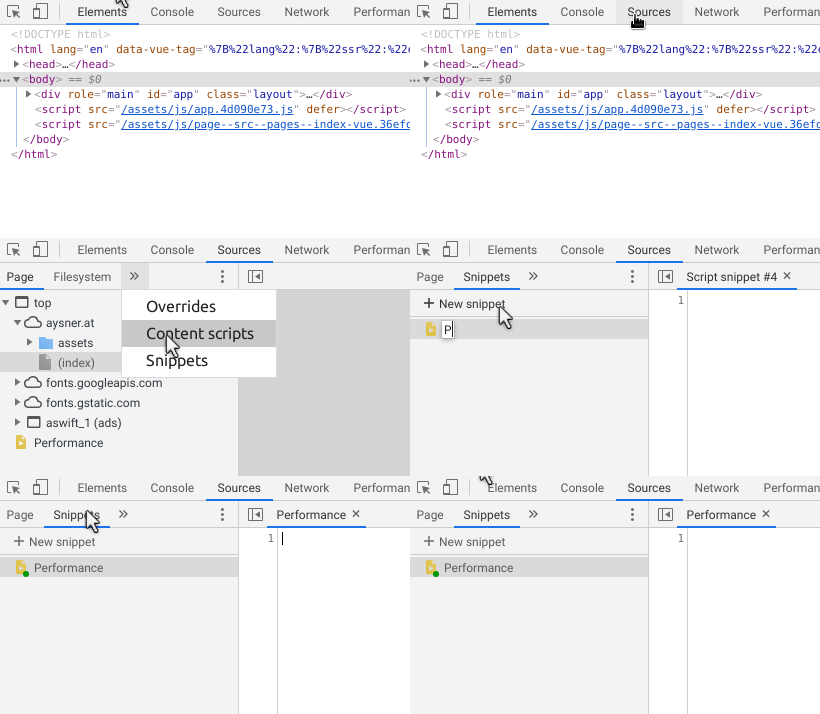
To quickly access the script we can add it to the Chrome Developer Tools. Chrome is able to save JavaScript snippets for a long time.
These snippets are an extremely powerful feature of the Developer Tools. We can access all the functions and variables that we also have in the developer console.
So a snippet like
copy($0);would copy the HTML source of the element, wich is currently selected in the "Elements" tab, to the clipboard.
We can add our snippet under "Sources > Snippets > New snippet"

(function() {
	let timing = performance.timing;
	let consoleOutput = '';

	let timings = {
		"Server response (TTFB)": timing.responseStart - timing.requestStart,
		"HTML download from Server": timing.responseEnd - timing.responseStart,
		"DOM interactive": timing.domInteractive - timing.responseEnd,
		"DOM complete": timing.domComplete - timing.responseEnd,
		"Load event start" : timing.loadEventStart - timing.responseEnd,
		"Load event end" : timing.loadEventEnd - timing.responseEnd,
		"Load event duration" : timing.loadEventEnd - timing.loadEventStart
	};

	for(let element in timings) {
		consoleOutput += (element + ' ').padEnd(32, '.') + ' ' + timings[element] + 'ms\n';
	}

	console.log(consoleOutput);
})();
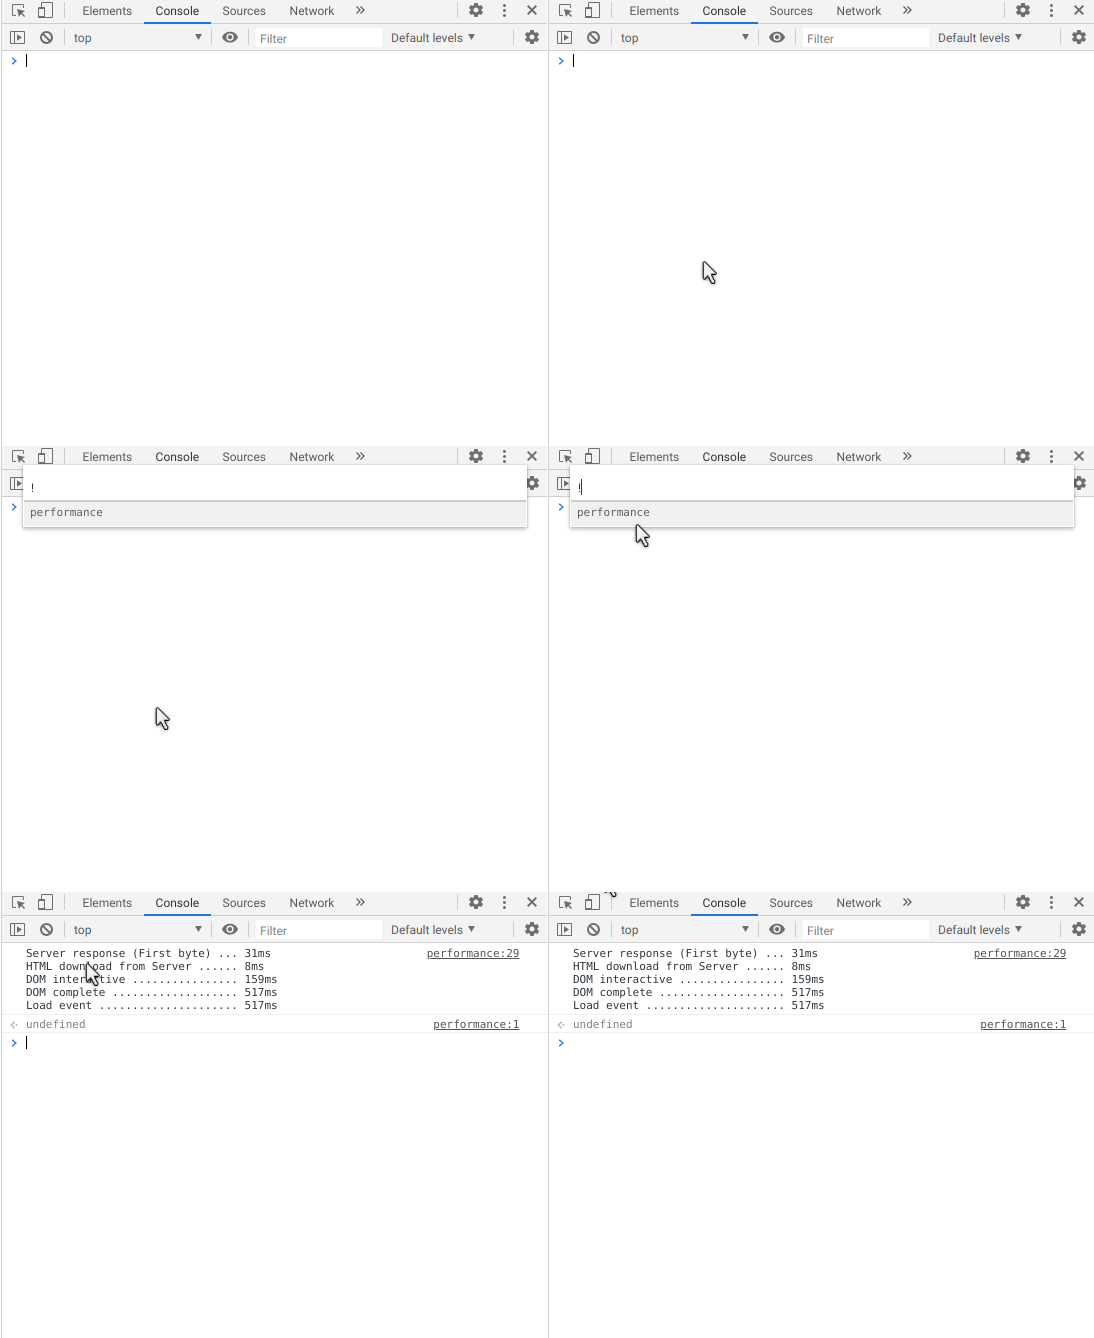
We can now access it here when needed, but even faster is pressing CTRL + P in the Chrome Developer Tools and entering a callsign. This displays a list of all snippets - no matter which tab you are currently in.

References